AcaDraw
Create science drawings with AI in seconds
About AcaDraw
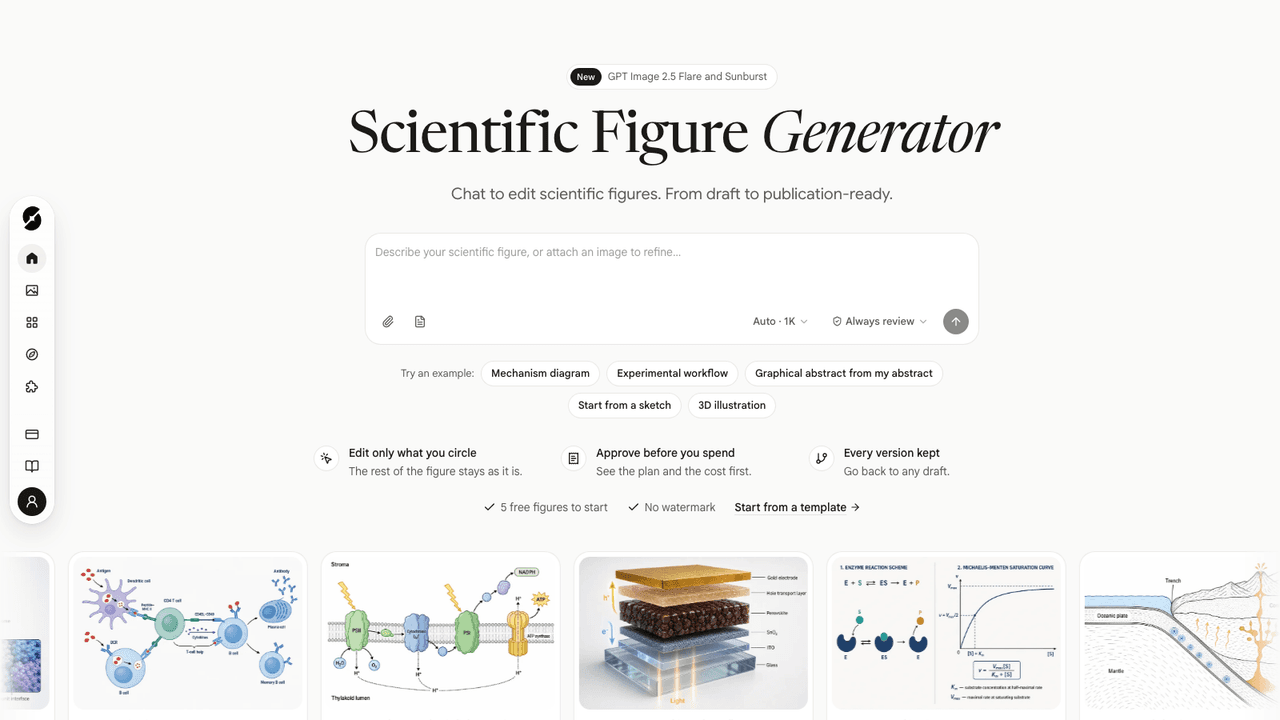
AcaDraw is a web tool for making scientific illustrations and research diagrams from a written description. You describe the figure you need, such as a signalling pathway, a lab setup or a process overview, and it generates an image you can refine in chat or by drawing arrows and notes on it. It can also build editable flowcharts for draw.io or Excalidraw and convert images into editable SVG, PowerPoint or Visio files. It is aimed at students, researchers and educators who need figures for papers, posters, theses and presentations without drawing them by hand.
You type a description of the figure, choose a resolution and aspect ratio, and AcaDraw generates the illustration. You then refine it in a conversation or mark changes directly on the image, and the AI returns one revised version with every note applied. When the figure is ready you export it as PNG, JPG, SVG or PDF, or convert it into an editable vector or diagram file for further work in other software.
- •AI science drawing - Generates scientific and nature illustrations from plain English or Chinese prompts at 1K, 2K or native 4K resolution.
- •Annotate and edit - Draw arrows and short notes on an illustration, and each becomes a numbered instruction applied in a single clean revision.
- •Editable diagrams - Creates flowcharts and research diagrams that open in draw.io or Excalidraw, and can replicate an existing diagram from an image.
- •Image to SVG - Converts science illustrations into editable SVG for Adobe Illustrator or Affinity Designer, with text-only or all-elements modes.
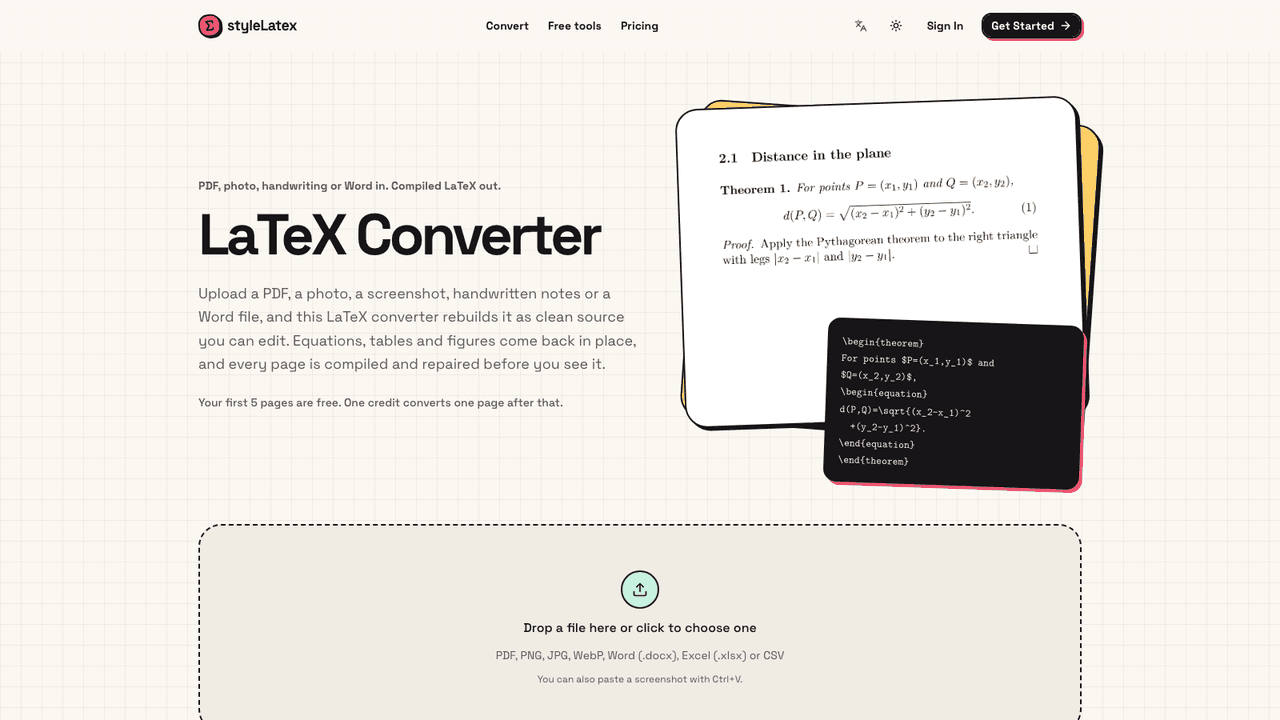
- •Image converter - Turns images into PowerPoint or Visio files and upscales them to 2K or 4K using the same credit balance.
Graduate students and researchers use it to produce figures and graphical abstracts for papers and theses. Educators use it for teaching diagrams and slides. Lab and science communication teams use it to draft protocol and process illustrations they can then edit in their usual vector or diagram software.
Pricing
$0 - $31.92/mo
Discounted on the vendor page, until 22 November 2026
- Free$0/mo
- Plus
$19.90$15.92/mo - Max
$39.90$31.92/mo - Basic$7.92 once
- Standard$15.92 once
- Premium$31.92 once